
The above chart show the movements of a Brownian motion, using the settings as adjusted by the two sliders. Any change to the mu (μ) or sigma (σ) values will automatically get applied to future movements on the chart.
A Brownian motion is defined by the below formula, and it's the mu and sigma parameters we can change. Changing these will either adjust the drift (mu) or the volatility (sigma).
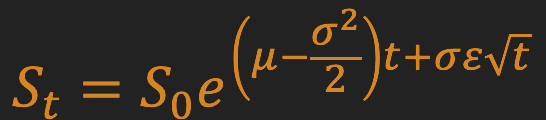
There are many use cases for a Brownian motion, one of which is to model the price movement of a financial asset.
This page was made available as part of a blog post diving into potential extensions we could make to the above formula while trying to make a better model for stock price movements by introducing a time dependent drift.